range·bound / ˈrānjˌbound/• adj. (generally of market prices) not straying outside a particular range Source: Encyclopedia.com
After a strong recovery in the stock market following the Great Recession, the last couple of years for investors have been lackluster–better yet, frustrating, but it hasn’t been due to lack of excitement. We’ve had the Fed raise rates, the market getting upset about rates being raised, a 20% correction, positive US economic data, energy prices declining, China slowing, and the list goes on. These events have led to swings in the market, but after a year, there has been little to no actual progress. As you can see below, the market, represented by SPY (a S&P 500 Index ETF), has bounced around, but it is at the same level it was twelve months ago. Think of it as a running back bouncing sideline to sideline to avoid being tackled, only to be taken down at the line of scrimmage. He probably ran 50 yards, but it’s still 2nd and 10.
Before we move on, for those new to reading charts, let me give you a little background: this is a technical chart for the S&P 500 Index ETF, SPY . Technical charts are helpful in reading the price movement of an investment. This is done by examining the red and black bars, which are called candlesticks. A red candlestick represents a negative period. A black candlestick represents a positive period. The length of the candle stick represents how the price moved over that period of time. Candlesticks can represent minutes, hours, days, weeks, months, and years. This particular chart shows the daily price for SPY from May 2015 – May 2016, so each candlestick shows us the range of SPY’s price movement each day.
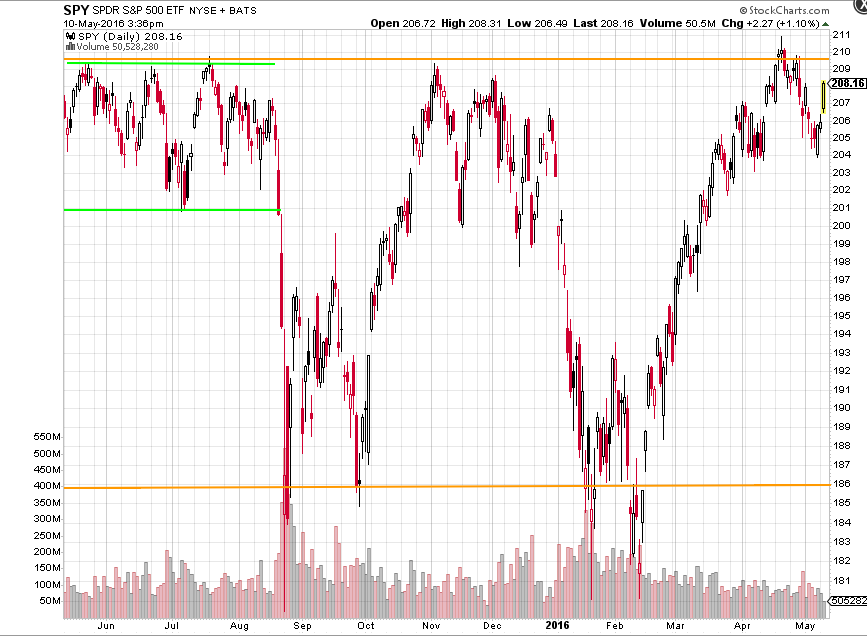
You’ll notice the movement of the candlesticks over the last twelve months has been contained by the orange lines I’ve drawn in; these lines represent the upper and lower limits of the range SPY has been trading in, which shows we are in a range-bound market. Once SPY reaches these levels, it turns and moves in the opposite direction. As this behavior continues, it becomes more frustrating for a long term investor. After all, we invest with the hope that over time we will see our investments grow, but as long as the range persists, our investments tread water. Traders, on the other hand, don’t mind a range-bound market because they have the opportunity to trade in and out of the market trying to catch the upward movement, and sit out, or even take a short position in (make money as prices fall), the downward movement. But, we are not traders, and we don’t try to time the markets. Instead, as investors, we get the stress of the downward movement, the excitement of the upward movement, and the disappointment of being at the same level as a year ago.
Before you give up hope on the long term potential of investing producing returns for your portfolio, let’s expand our time period. After all, we are not investing for one year; our focus should be on a long term investment strategy–and I’ll add that the investment strategy should be driven by a financial plan addressing your personal situation and goals. Below is a chart that looks at SPY from May 1996 to May 2007. This chart is a monthly chart, which means each candlestick represents SPY’s price movement each month.
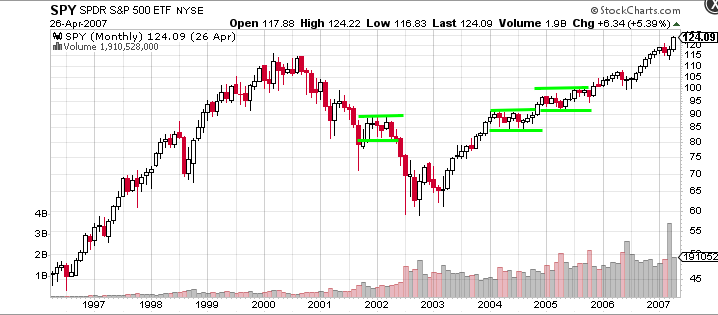
Just as I did in the prior chart, I’ve highlighted three times SPY was stuck in a range; these are represented by the green lines. What can we takeaway by looking at these periods? First, each range lasted for a different amount of time. Second, the ranges occurred at random times during SPY’s long term movement. Third, none of the ranges’ beginning, or end were predictable. Just like everything with the market, the beginning, upper and lower levels, and end of a range-bound market cannot be predicted. Finally, range-bound markets are not abnormal. They are a part of the game we play called investing. We cannot expect the markets to grow without risk, and sometimes that risk is a range-bound market.
Let’s get back to our current range-bound market; the chart below picks up where the previous chart left off. I’ve highlighted our current range, which we’ve been sitting in since mid-2014. Unfortunately, I cannot tell you how much longer we’ll stay in it, or which direction it will break. So, what’s an investor to do? Easy, stick to the plan. Don’t deviate from your plan and try to take things into your own hands because you’ll get it wrong. And, don’t worry–while you are waiting for this market to break out of its range, it’s not a total lost cause.

As a long term investor continuing to save into an investment account like a 401(k), or Roth IRA, you are able to purchase shares of your investments as the market moves to the lower end of the range; think of it as buying investments on sale. By saving a specific amount on a regular schedule you are participating in a dollar cost averaging program, and in a range-bound market dollar cost averaging is your friend. Everyone knows the key to making money in the market is “buy low, sell high” (if only it were that simple), and dollar cost averaging helps you purchase investments while the market is lower.
What if you are retired and no longer saving? Luckily, you are not on the outside looking in. There is a good chance some of the investments you hold distribute dividends and capital gains. These distributions can be reinvested to take advantage of the market’s movements similar to a dollar cost averaging program. All investors experience this advantage, but it becomes more valuable to retirees since they are no longer contributing to their accounts. The dividends and capital gains can also be received as cash, which can be used for income needs; this allows the investor to keep their funds invested for when the market decides to move upward. Chances are these distributions are more than what the bank is willing to pay you, which makes it a better alternative than sitting in cash. Disclaimer: This is assuming you can afford to sit in the investments, you have liquidity elsewhere in your portfolio, and your investments are aligned with your risk tolerance. Talk with your financial advisor to make sure the above comment works for your plan.
I don’t deny the frustration of seeing the markets bounce around with no end in sight, but since there is no crystal ball to tell us when the range will be broken and in which direction, remaining in your long term investment strategy remains the best approach. Rest assure the range will eventually be broken, and if it happens to be to the upside, you want to make sure you are there to participate.
Note: Naturally, as I’ve been editing this post, Michael Batnick at The Irrelevant Investor wrote on the same topic. He puts out posts like a madman! Check out his post as a compliment to mine. Investing In A Flat Market .
Disclaimer: Nothing on this blog should be considered advice, or recommendations. If you have questions pertaining your individual situation you should consult your financial advisor. For all of the disclaimers, please see my disclaimers page.