With Donald Trump as the last standing Republican presidential candidate, and Hillary appearing to have a lock on the Democratic nomination, the conversation in financial media has already turned to “which candidate is better for your portfolio?” Although no one really knows what impact the election will have on the market’s short term return, it will be a daily conversation for the remainder of the year. I thought it would be fun to look at past presidential elections to see if there are any patterns that could help in guessing what might happen next year.
Let’s take a look at the last 10 presidential elections and the return of the S&P 500 Index the year following the election (the first year of the new 4 year term). As you can see below, there is no predictable pattern. There are positive years, along with negative years– this really should not be a surprise.
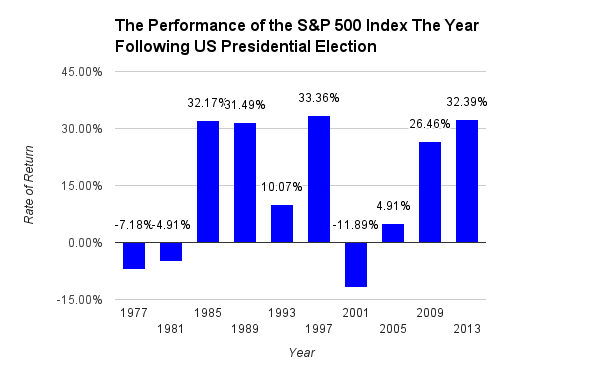
Source: Dimensional Fund Advisors Returns Web.
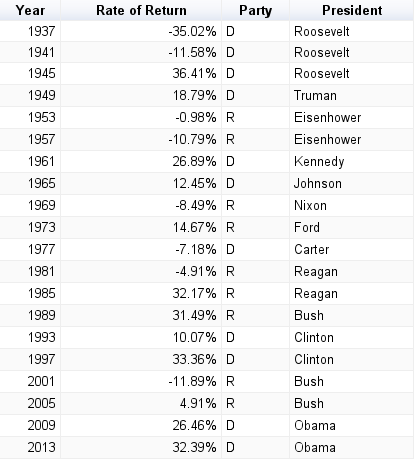
This is a small sample, and there are some specific outcomes we may see in this year’s election that can be analyzed. Let’s increase the sample size to the last 20 US Presidential elections, and let’s also look more closely at how some potential outcomes in this year’s election have historically played out in the market. Specifically, what impact did an outgoing two term president have on the market? What impact did a transition from a Democratic president to a Republican president have on the market? And finally, what impact did the president remaining with the Democratic party have on the market?
Note: When referring to the “market”, I am referring to the S&P 500 Index. The historical returns were taken from Dimensional Fund Advisors’ Returns Web.
The Numbers Behind Past Elections
In the last 20 US Presidential elections, the S&P 500 Index has averaged 9.46% in the year following the election…not too bad. You’ll notice the range of returns is broad, -35.02% to 36.41%. And herein lies the problem with averages, very little time is actually spent at the average; the majority of time is spent either above, or below it. Since just looking at the last 20 elections doesn’t provide enough insight to know what might happen next year, let’s look more closely at the previously mentioned potential outcomes.
Only one of the outcomes is certain; we will have a two term president leaving the White House, so we’ll start there. In the last 20 elections, the US has seen a two term president leave the White House six times, and the average return for the S&P 500 Index in the year following the election was 14.09% (See table below).
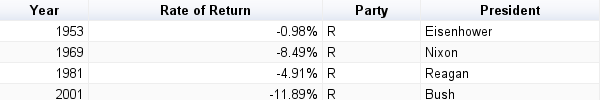
If Donald Trump should win the general election, the White House would change hands from a Democratic president to a Republican president. This has happened four times in the last 20 elections, and the average return for the S&P 500 Index in the year following the election was -6.57% (See table below).
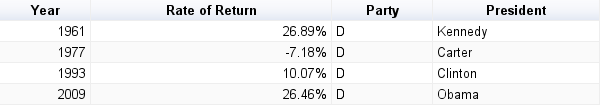
Just for fun, I thought I’d see what happened when the White House went from a Republican president to a Democratic president. This has also happened four times, but with a much better average return of 14.06% (See table below).
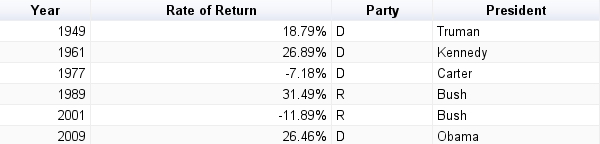
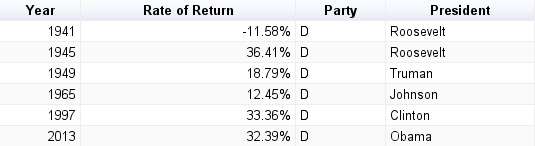
Finally, if Hillary Clinton, or Bernie Sanders since he’s technically still in the hunt, wins the general election, the White House would continue to be occupied by a Democratic president. This has happened six times in the last 20 presidential elections, and the average return for the S&P 500 Index in the year following the election was 20.30% (See table below).
According to the averages, you could argue a Democratic victory in November’s presidential election would be better for your portfolio. However, the flaw with drawing this conclusion from the above data is other important factors are omitted. The numbers do not take into consideration the current economic health of the United States, the strength of the global economy, where we are in the business cycle, and a number of factors that impact our overall economy.
So how do you prepare your portfolio for the upcoming election? You don’t. Your portfolio should already be prepared for your long term investment strategy, and your long term investment strategy should be driven by your financial plan. If you’re a long term investor, you shouldn’t be focusing on a single event (the general election), or even a single year (2017) in the market. Instead, you should be focused on the long term, and rather than spending time listening to the pundits debate each other, spend that time learning more about the candidates’ policies so you can be an informed voter.
Edit: As I was finishing this post, Barry Ritholtz’s recent piece for Bloomberg View came across my Twitter feed. Barry takes a different approach, looking more closely at the policies of the candidates. It’s a good complimentary read to my research. Plus, Barry is always a good read. Check it out!
Barry Ritholtz for Bloomberg View: What The Next President Will Mean For Your Portfolio
Disclaimer: Nothing on this blog should be considered advice, or recommendations. If you have questions pertaining your individual situation you should consult your financial advisor. For all of the disclaimers, please see my disclaimers page.