
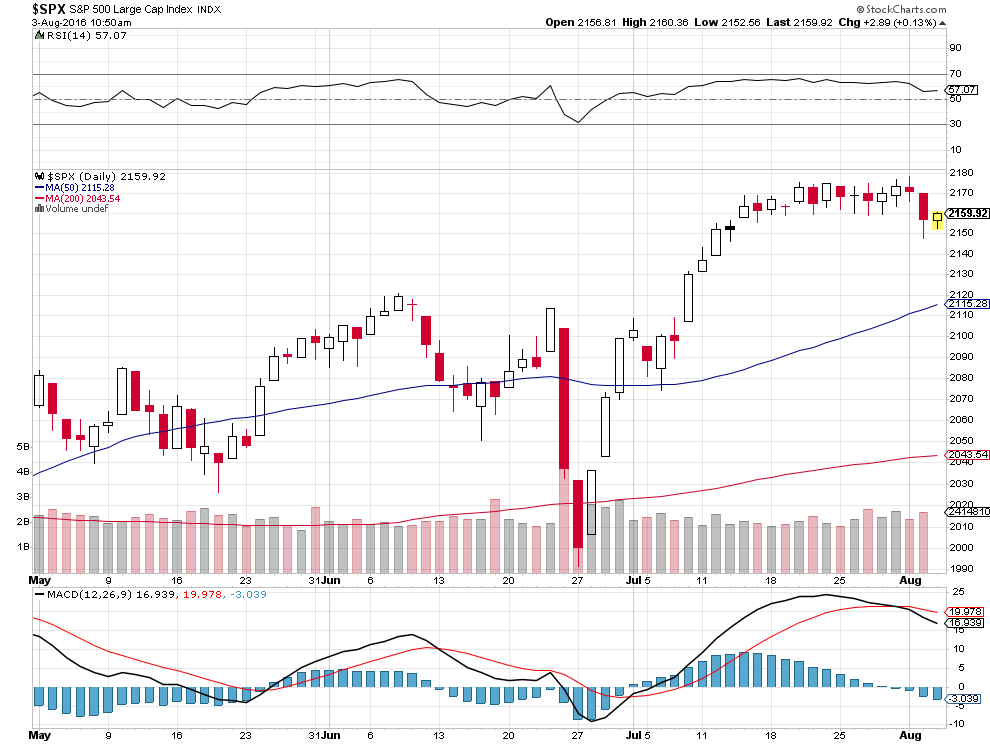
Don’t be so quick to “sell in May, and go away”.
“Sell in May, and go away, and come back on St. Leger’s Day” was a reality in old England. In the days prior to air conditioning, English stockbrokers would leave to escape the summer heat, and would not return until September, after the final horse race of the British Triple Crown–the St. Leger’s Stake. With stockbrokers gone until the race on St. Leger’s Day and no internet, mobile trading, Bloomberg machines, or algorithms to keep the trading going, the markets remained relatively quiet–there was very little trading. Can you imagine a quiet summer in the markets? What would the crew at CNBC talk about?
Obviously, times have changed, but I have no doubt that you will hear investors talk of selling in May, and going away every year. Besides tradition, why does this old adage live on? Well, historically, the markets do not perform as well during the summer as the rest of the year. According to the good folks over at Bespoke Investment Group, going back to 1929, the S&P 500 Index has average a 1.87% gain in the months May-October. In contrast, it has averaged has averaged 5.04% in November-April. There are many theories as to why this occurs, but like everything with stock market, no one really knows. While the Wall Street adage is rich in history, and supported by data, it is not always the best strategy to follow.
So far this year, investors who sold in May would have missed out on a 5.82% gain in the S&P 500 Index and a 3.68% gain in the MSCI All-Country Index (if they were globally diversified–as I think investors should be), which is not too bad. In a year that started out with talk of recession and market crashes–remember January–missing the beginning of the summer would have resulted in investors missing 75% of the YTD gain in the S&P 500 Index (7.66% through 7/31/16) and 60% of the YTD gain in the MSCI All-Country Index (5.98% through 7/31/16). While we are only halfway through the summer trading period, the last 10 years paint a positive outlook for what we might see. We’ll see what the chart looks like after October–no predictions coming from me!
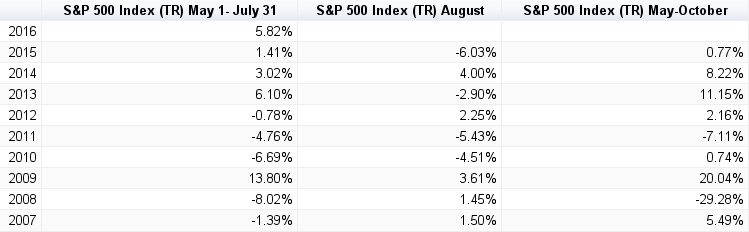
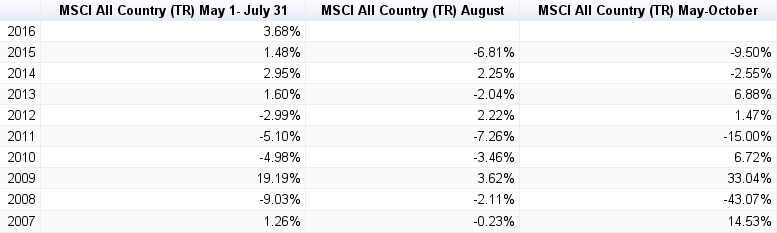
As much fun as it is to look back at historical numbers to develop investment strategies, it rarely provides an advantage. The charts above do not provide any material information that an investor could use to confidently develop an investment strategy for the future. Looking at averages does not help either; the problem with averages is that we very rarely spend time AT the average. Instead, we spend our time above and below the average. The only takeaway from the charts is that sometimes we’ll have good summers, and sometimes we’ll have not so good summers. It’s probably best for long term investors to ignore the urge to sell in May and sit on the sidelines for the summer; you never know when we may have a start to the summer like this year. Plus, what’s the alternative–sitting in cash?
Note: I’m well aware that I probably just jinxed the rest of the summer. 🙂
Disclaimer: Nothing on this blog should be considered advice, or recommendations. If you have questions pertaining your individual situation you should consult your financial advisor. For all of the disclaimers, please see my disclaimers page.